Data & News
Political Temperature
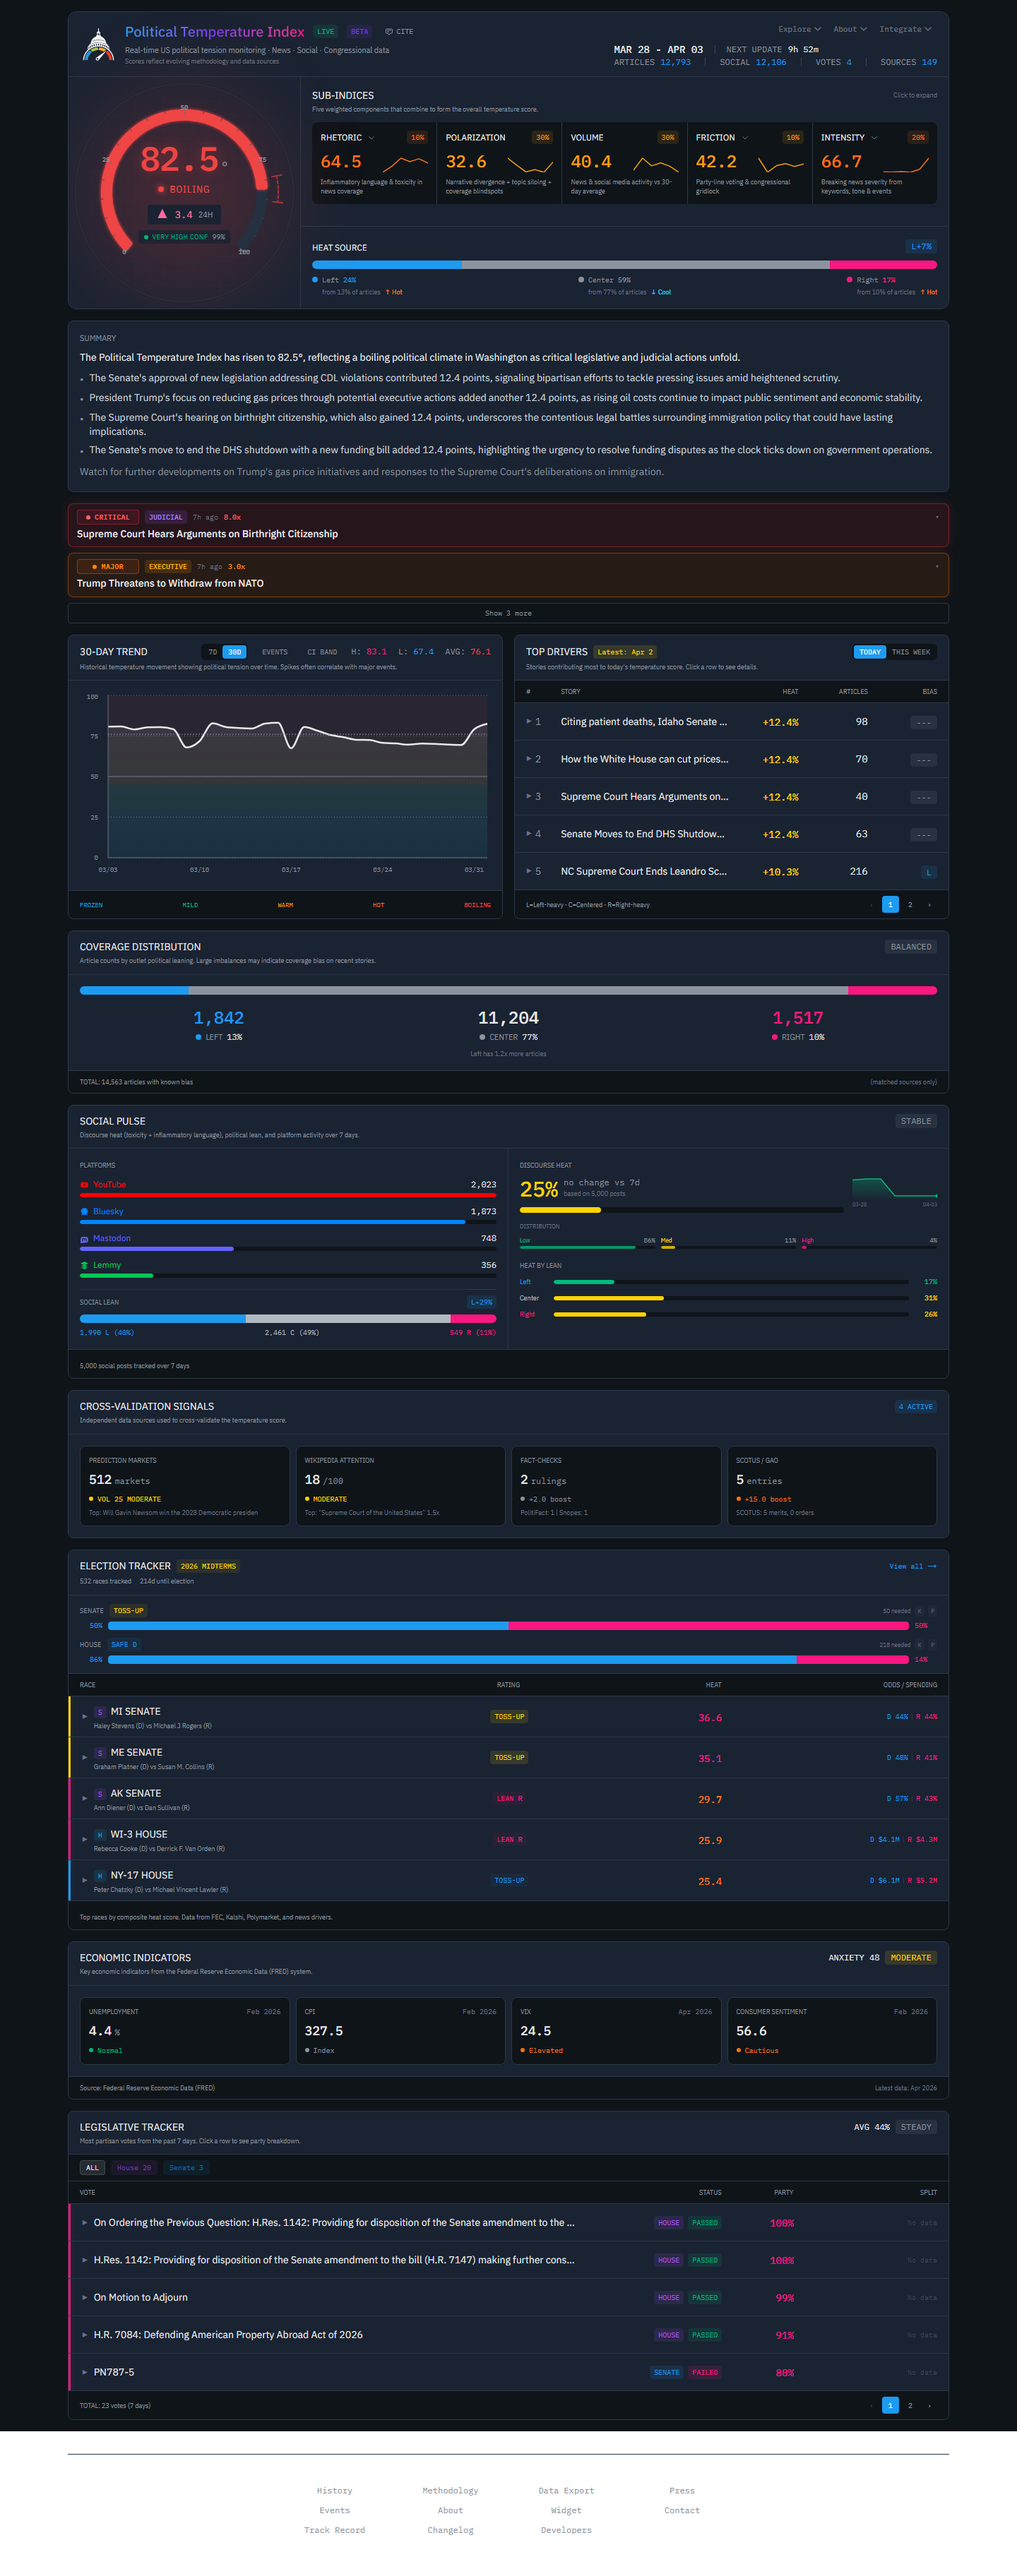
Real-time US political tension dashboard aggregating 24+ data sources into a unified 0-100 index.
Next.jsReactSupabaseClaude APIOpenAITailwind CSS
About This Project
A non-partisan political tension monitoring dashboard that aggregates data from 24+ sources including news outlets, social media, and congressional voting records. Generates a daily temperature index on a 0-100 scale across five weighted sub-indices: Rhetoric, Polarization, Volume, Friction, and Intensity. Uses AI-powered analysis via Claude and OpenAI APIs with background processing through Inngest. Features trend visualization, top news drivers, election tracking, and economic indicators.